Chapter 105 Demographics of the Aging Population Margery L. S. Gass and Robert W. Rebar Table Of Contents | |
Margery L. S. Gass, MD Robert W. Rebar, MD |
INTRODUCTION | ||
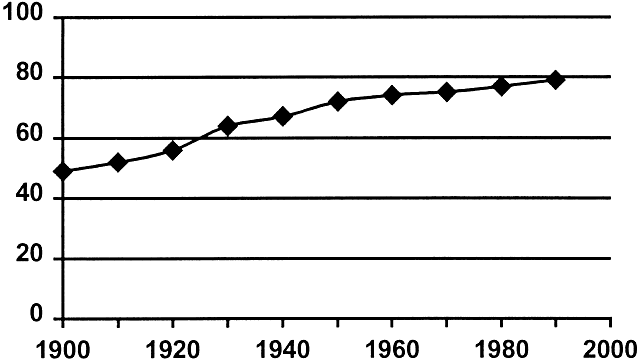
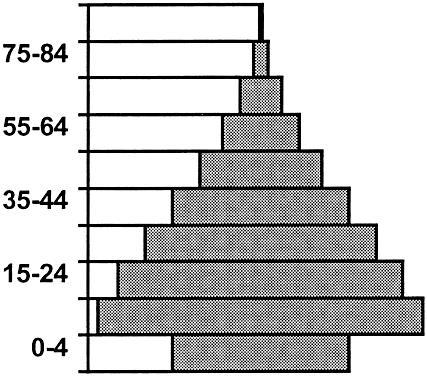
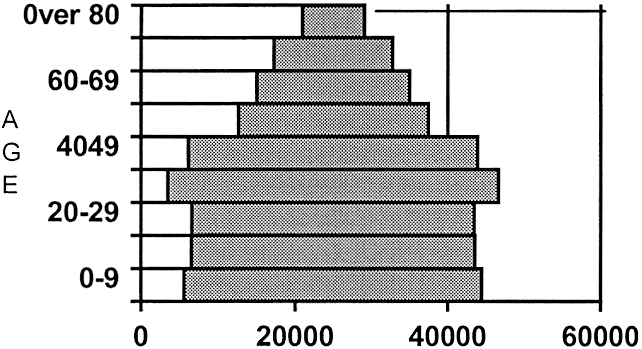
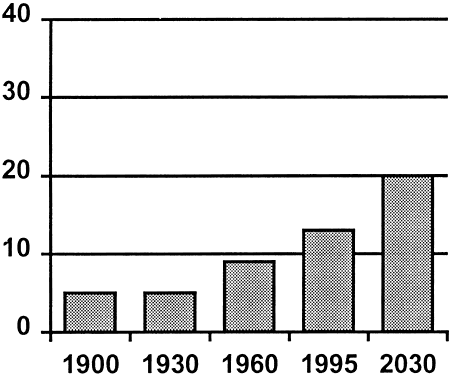
An increasing proportion of the population is living beyond 65 years of age. In 1900, only 5% of the population was older than 65.1 In the year 2030 it is projected that nearly 20% of the population will be older than 65 (Fig. 1).2 Life expectancy curves for women indicate a remarkable improvement in life expectancy from 51 years in 1900 to 80 years in the year 2000 (Fig. 2). The curve gives a false impression that only in this century have women begun to outlive their reproductive function; however, the figures depicting the distribution of the population in the years 1900 and 1995 illustrate the fact that the low average life expectancy in 1900 was the result of the numerous early deaths in infancy, childhood, and young adulthood (Figs. 3 and 4).2,3 Because many of these deaths have been eliminated by advances in health care, a greater proportion of those born now live a long life. Reducing infancy and childhood deaths has dramatically increased the calculated life expectancy of the U.S. population. This phenomenon has been referred to as rectangularization of the survival curve.
|
GENDER DIFFERENCES IN LIFE EXPECTANCY | ||||||||||||
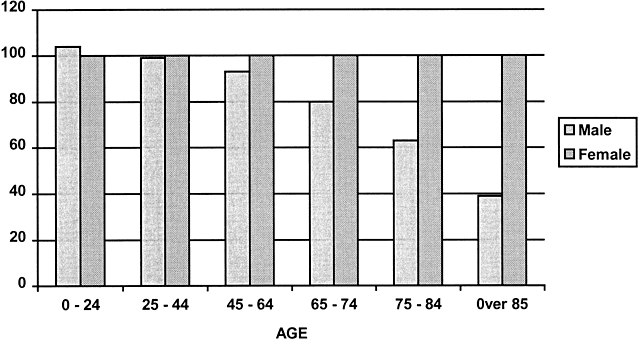
Men and women do not have the same life expectancy. In 1994, male life expectancy in the United States was 72.3 years, and female life expectancy was 79.0 years.4 The gender discrepancy is even greater between African-American men and women (Table 1). Life expectancy around the world is greater for women than for men in all but a few Third World countries. In the United States, the number of men per 100 women older than 65 years of age has gone from approximately 90 in 1950 to 69 males per 100 women older than 65 in 1995.5 There are a few more male babies than female babies born each year, and below the age of 14, there are approximately four more males for every 100 females. That number has been relatively constant for the past 40 years.6 After age 14, the male death rate is higher than the female death rate, leading to a marked imbalance between the sexes older than 75 years (Fig. 5). As the elderly become an enlarging proportion of the population, concerns arise regarding issues such as quality of life, health status, and the problem of chronic ailments and disabilities. The economic burden of poor health will be another area of concern for individuals and for society as more people live long enough to acquire limitations. TABLE 1. Life Expectancy at Birth, 1994
|
INDEPENDENT LIVING |
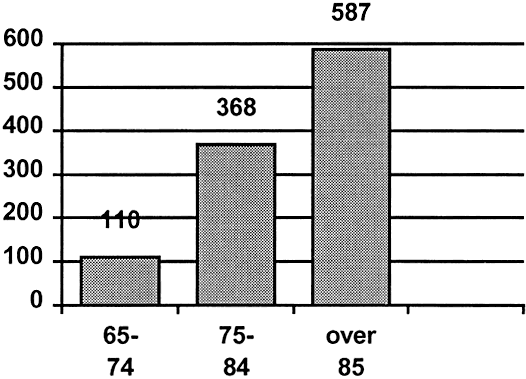
One measure of quality of life is the percent of the population able to live independently compared with the percent requiring a nursing home facility. Over the age of 65, there are 1,065,800 women in nursing homes.7 That figure represents about 5% of the women older than 65. The number rises sharply per decade (Fig. 6). Within the nursing homes, 75% of the residents require assistance with dressing, 70% cannot walk independently, and more than 50% have a continence problem with bowel or bladder.8 Incontinence and propensity to fall are major reasons for placement in a nursing home. These figures regarding impairment do not include the women receiving assistance in their own home. Among the noninstitutionalized, limitations of activity are reported in a more generic fashion. In order of increasing limitations, these are the categories: limited but not in a major activity; limited in amount or kind of activity; and inability to carry on major activity (i.e. bathing, dressing, shopping, or eating). The older the population, the greater the percent with limitations. In 1994, approximately 12% of the noninstitutionalized women older than 75 were not able to perform major activity, and an additional 34% of that age group were split between the other two lesser categories of limitation.9 The absence of a spouse may contribute to the likelihood of a nursing home admission. In 1985, most elderly people admitted to a nursing home did not have a spouse. Only 16% of nursing home residents had a spouse compared with 44% of the functionally impaired elderly still living in the community.10 Data regarding the presence of living children do not support the theory that lack of living children contributes to nursing home admissions. Most elderly nursing home residents (63%) had living children. Even among residents older than 85 years, 69% had living children. Functionally impaired elderly African Americans are more likely to live with children than their Caucasian counterparts are. Among elderly nursing home residents, only 42% of African Americans had living children compared with 65% of Caucasians.11 Information regarding confounding factors is not available. It is unknown whether geographic availability of children, level of skilled care needed, or financial issues play a role in these data. About one third of Americans older than 65 who are living in the community are living alone.12 This represents about 8 million people, one half of whom are older than 75. Eighty percent of those living alone are women, and most are widowed. The longer life expectancy for women, coupled with the fact that they tend to marry older men, contributes to this imbalance. Many live in the same place they lived for years. Although 29% of those surveyed had no living children, most of those with children stayed in touch through weekly or more frequent visits or telephone calls. Mail was not a commonly used means of communication. Most thought they were doing well on their own.13 |
EDUCATION AND HEALTH |
In 1984, the National Health Interview Survey, an annual survey of 42,000 households conducted by the National Center for Health Statistics, added a special “Supplement on Aging” to collect additional information on the older segment of the population. Preliminary data from a sample of 5982 people living in the community reveal that education levels are lower among the elderly.14 About one half of the people 65 years of age and older had not completed high school. One third had not gone beyond eighth grade. Among those older than 85, 48% had not completed eighth grade. These data do not imply that the less well educated live longer. The opposite is true: better educated people tend to survive longer. The data reflect the customs of the era when these people were young. Among those older than 65, 20% were college graduates.15 |
INCOME LEVEL AND HEALTH |
Besides the expected effect of aging on physical limitations, family income also shows some correlation with limitation of activity. Age-adjusted data reveal any degree of limitation of activity was found to be 9.2% for families with an income over $50,000. In families in which the income was less than $14,000 per year, the rate of limitation of activity was as high as 26.4%.16 Income levels also correlate with the number of days spent in short-term hospitalizations. In 1994, persons with an annual family income of $150,000 or more averaged 320 days in the hospital per 1000 population, compared with persons with a family income less than $14,000, who averaged 970 days of hospitalization, a threefold difference.17 With the custom of retiring at 65 years of age, most of the elderly are no longer gainfully employed. It has been questioned whether the elderly will be able to support themselves adequately for another 20 to 25 years. Statistics do not indicate an increasing level of poverty among the elderly until age 75. The percent of the population that falls below the poverty level appears to be relatively constant at about 11% between the ages of 55 and 74. After 75, the overall percent of the population below poverty level is 13.9%, but the rate is twice as high for Hispanics (23.2%) and African Americans (29.4%) as it is for Caucasians (12.5%)18 |
HEART DISEASE |
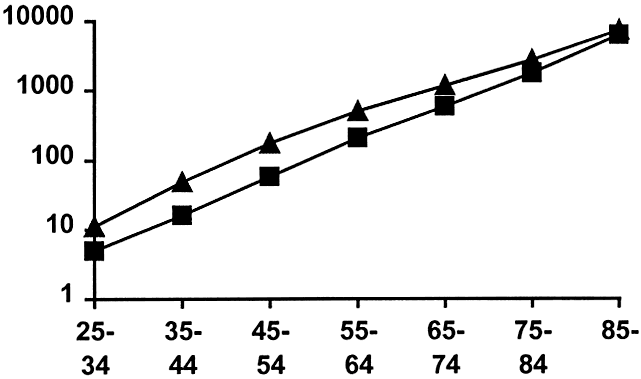
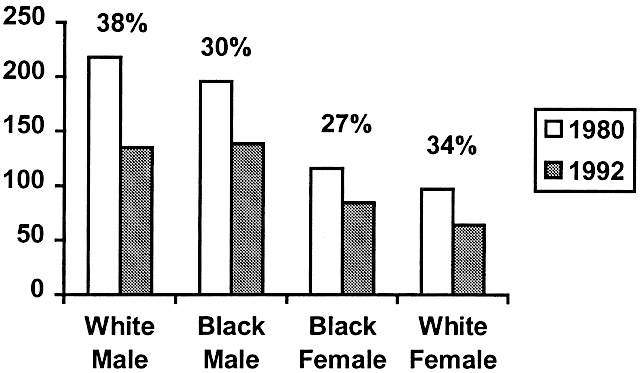
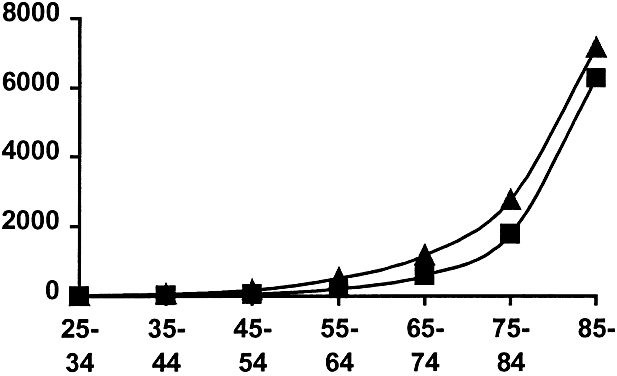
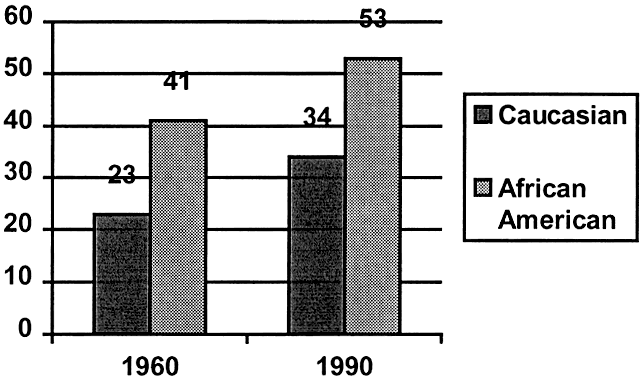
Heart disease in women has gained attention in recent years. For many years, most of the research on heart disease had been conducted with males, and it was not known whether these findings could be extrapolated to females. The number one cause of death for men and women is heart disease. More women die of heart disease than men: 374,849 women versus 362,714 men in 1995.19 In general, heart disease in males has an earlier onset, by approximately 10 years. Arithmetic graphs reveal almost parallel lines, with a steep rise after age 50 (Fig. 7).20 The later onset in women has been attributed to a protective effect of the female hormones, and accumulating data suggest that estrogen may provide cardiovascular benefits through a wide variety of mechanisms. Plotting the increase in myocardial infarctions on a semi-logarithmic scale yields a straight line, raising the possibility that heart disease is more related to age than to hormonal status (i.e., menopause). As age increases, the male and female death rates approach each other because of a subtle decline in the rate of increase for men (Fig. 8). A major healthy trend during the past 40 years has been a marked decrease in the rate of death from heart disease (Fig. 9). All Americans have benefited: male and female Alaskan Natives, African Americans, American Indians, Caucasians, and Hispanics. Women in particular have seen decrease from 234 deaths per 100,000 in 1950 to 100 deaths per 100,000 in 1995.21 No doubt many factors have contributed to this decline, including a decrease in smoking prevalence, control of hypertension, angioplasties, coronary artery bypass procedures, thrombus-dissolving treatments, cholesterol-lowering drugs, and fitness programs. Despite the decline in the death rate from heart disease and the attention focused on lowering cholesterol and blood pressure, obesity is increasing in the United States. In 1960, 25.6% of all women were classified as overweight. In 1990, 35.9% of women were classified as overweight.22 Overweight was defined as a body mass index of 27.3, the equivalent of a 5 foot 5 inch woman weighing 160 pounds. Among African-American women, 53% are classified as overweight using this definition (Fig. 10).23 Despite the increase in obesity, American women have managed to decrease their serum cholesterol from 222 mg/dl in 1960 to 204 mg/dl in 1990. This represents a decrease in the percent of the population with high cholesterol from 34.5% to 20%.24 The incidence of high blood pressure (defined as 140/90 mm Hg) has declined from 33.7% in 1960 to 20.8% in 1990. Among women 65 to 70 years old, the incidence of hypertension was 81.5% in 1960, compared with 60.8% in 1990.25 |
TRENDS IN CANCER | ||||||||||||
Among the elderly and among all ages, malignancy is the number two cause of death. It is a relatively close second for men but trails further behind heart disease in women (Table 2). For the first time since the 1930s, the American Cancer Society reported a decline in the total number of new cancer cases and a decline in the cancer death rate in the United States.26 Between 1991 and 1995, the overall death rate decreased 2.6%. For women, this included a 1.5% per year decrease in colorectal cancer deaths from 1991 through 1994 and a 1.8% decrease in breast cancer deaths. Although men are beginning to see a decline in death rates from lung cancer, the lung cancer death rate for women is continuing to climb. This point deserves attention, because lung cancer is one cancer that can be reduced by decreasing cigarette smoking. TABLE 2. Deaths From Heart Disease and Malignancy in 1995
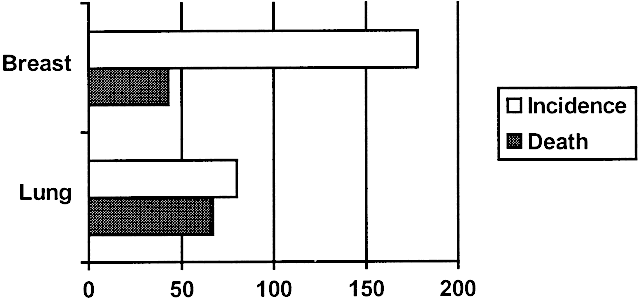
*After age 65 death from heart disease greatly surpasses death from malignancy. Smoking has declined overall from 42% of the population older than 18 in 1965 to 25% in 1993.27 In men older than 65, there has been a 53% decrease in the percent smoking (from 28% to 13%), and among women older than 65, the percentage has remained relatively constant at 10% during the past 30 years. The decline in lung cancer that would be expected from this trend has already been documented for men. In 1987, lung cancer surpassed breast cancer as the number one cause of cancer death for women. Even though there are more deaths from lung cancer, far more women get breast cancer than lung cancer. Estimates for 1998 indicate four times as many women will be diagnosed with breast cancer as will die from it (Fig. 11).28 An additional 30,000 women will be found to have carcinoma in situ of the breast. For those between 15 and 54 years of age, breast cancer is the number one cause of cancer death for women. For those between 55 and 74 years, cancer of the lung or bronchus results in more deaths than breast cancer, and for those older than 75, cancer of the lung or bronchus and cancer of the colon or rectum result in more deaths.29 The 5-year survival rate for breast cancer is 86% for Caucasians but only 70% for African-American women. For several cancers, including breast cancer, African-American women are experiencing a 10% to 15% lower survival rate.30 |
OSTEOPOROSIS |
Of all the hospitalizations due to injuries, fracture leads the list. Two of five injury-related discharge diagnoses are fractures. For those older than 75 years of age, three of five injury-related discharge diagnoses are fractures, and three of five of those fractures are hip fractures.31 In the United States, hip fracture rates are twice as high for women as for men. The average length of hospitalization for hip fracture is 11 days. Attention to osteoporosis has increased as the disease process has become better understood and as new agents for prevention and treatment have become available. Using the World Health Organization definition of osteoporosis as -2.5 standard deviations below the mean bone mineral density of a young healthy woman, 9.3 million women in the United States are estimated to have osteoporosis. Those with osteopenia, -1.0 to -2.5 standard deviations, number 16.8 million. A Caucasian woman has a one in six chance of having a hip fracture during her lifetime.32 After age 50, she has a 54% chance of any fracture occurring during the rest of her life.33 Racial differences in the fracture risk are significant and poorly understood. Mexican-American and African-American women have a much lower risk of vertebral fracture than Caucasian women.34 Low body mass index was found to be the strongest predictive factor for hip fracture in African-American women.35 Hip fracture carries by far the greatest morbidity, mortality, and cost. The increase in incidence occurs at a later age. The Colles' wrist fracture is the first to increase, followed by the spinal compression fracture and by the increase in hip fracture. The later onset of hip fracture in the elderly is probably related to the greater bone mass at the hip and to a different pattern of falling. A delay in reaction time with aging may prevent the person from breaking the fall with an outstretched arm, thereby exposing the hip to the full impact of the fall. The percent of people falling increases with age. Twenty-five percent of those older than 70 fall each year, and 35% of those older than 75 fall each year. For every 1000 people in a nursing home, there are 1600 fall per year.36 The rate of death as a complication of hip fracture is 15% to 20% and is associated with age and comorbid conditions. |
OTHER DISEASES |
A decrease has been reported for the third most common cause of death, cerebrovascular disease. The death rate per 100,000 women has decreased from 86 in 1950 to 25 in 1995.37 As with heart disease, men and women of all ethnic groups in the United States have experienced a decline in the death rate from cerebrovascular disease. Pulmonary diseases and diabetes mellitus are found in the top 10 causes of death for men and women, but the genders differ in that Alzheimer's disease appears on the list for women and suicide/homicide appears on the list for men.38 Suicide rates average 14 per 100,000 for those younger than 75 years, but above age 75, the rate is closer to 21 per 100,000. Even though suicide rates are higher for the elderly, admission to psychiatric inpatient services is lower for those older than 65 than for any other adult age group. Only one third of the women older than 65 years report consumption of alcoholic beverages, a rate much lower than other adult age groups, for whom the rates are 40% to 60% of the population.39 |
SURGICAL PROCEDURES |
Hysterectomy is the number one surgical procedure for women between the ages of 45 and 64.40 The number of hysterectomies has remained stable over 10 years at approximately 190,000 per year, but the rate per 1000 women has dropped from 8.2 to 7.1. After age 75, cardiac catheterization becomes the most common procedure. Coronary bypass procedures for women almost tripled between 1985 and 1995, increasing from 23,000 to 63,000 per year.41 |
CONCLUSIONS |
Many factors, including changes in lifestyle and advances in medical knowledge, have led to an enlarging proportion of infants born surviving to old age. As the elderly begin to represent an enlarging proportion of the population, appropriate concerns arise regarding such issues as quality of life, health status, and disabilities. The economic burden of poor health is another area of concern for individuals and for society as more people live a life long enough to acquire limitations. Data reveal many positive trends along with areas that still require attention and research. |